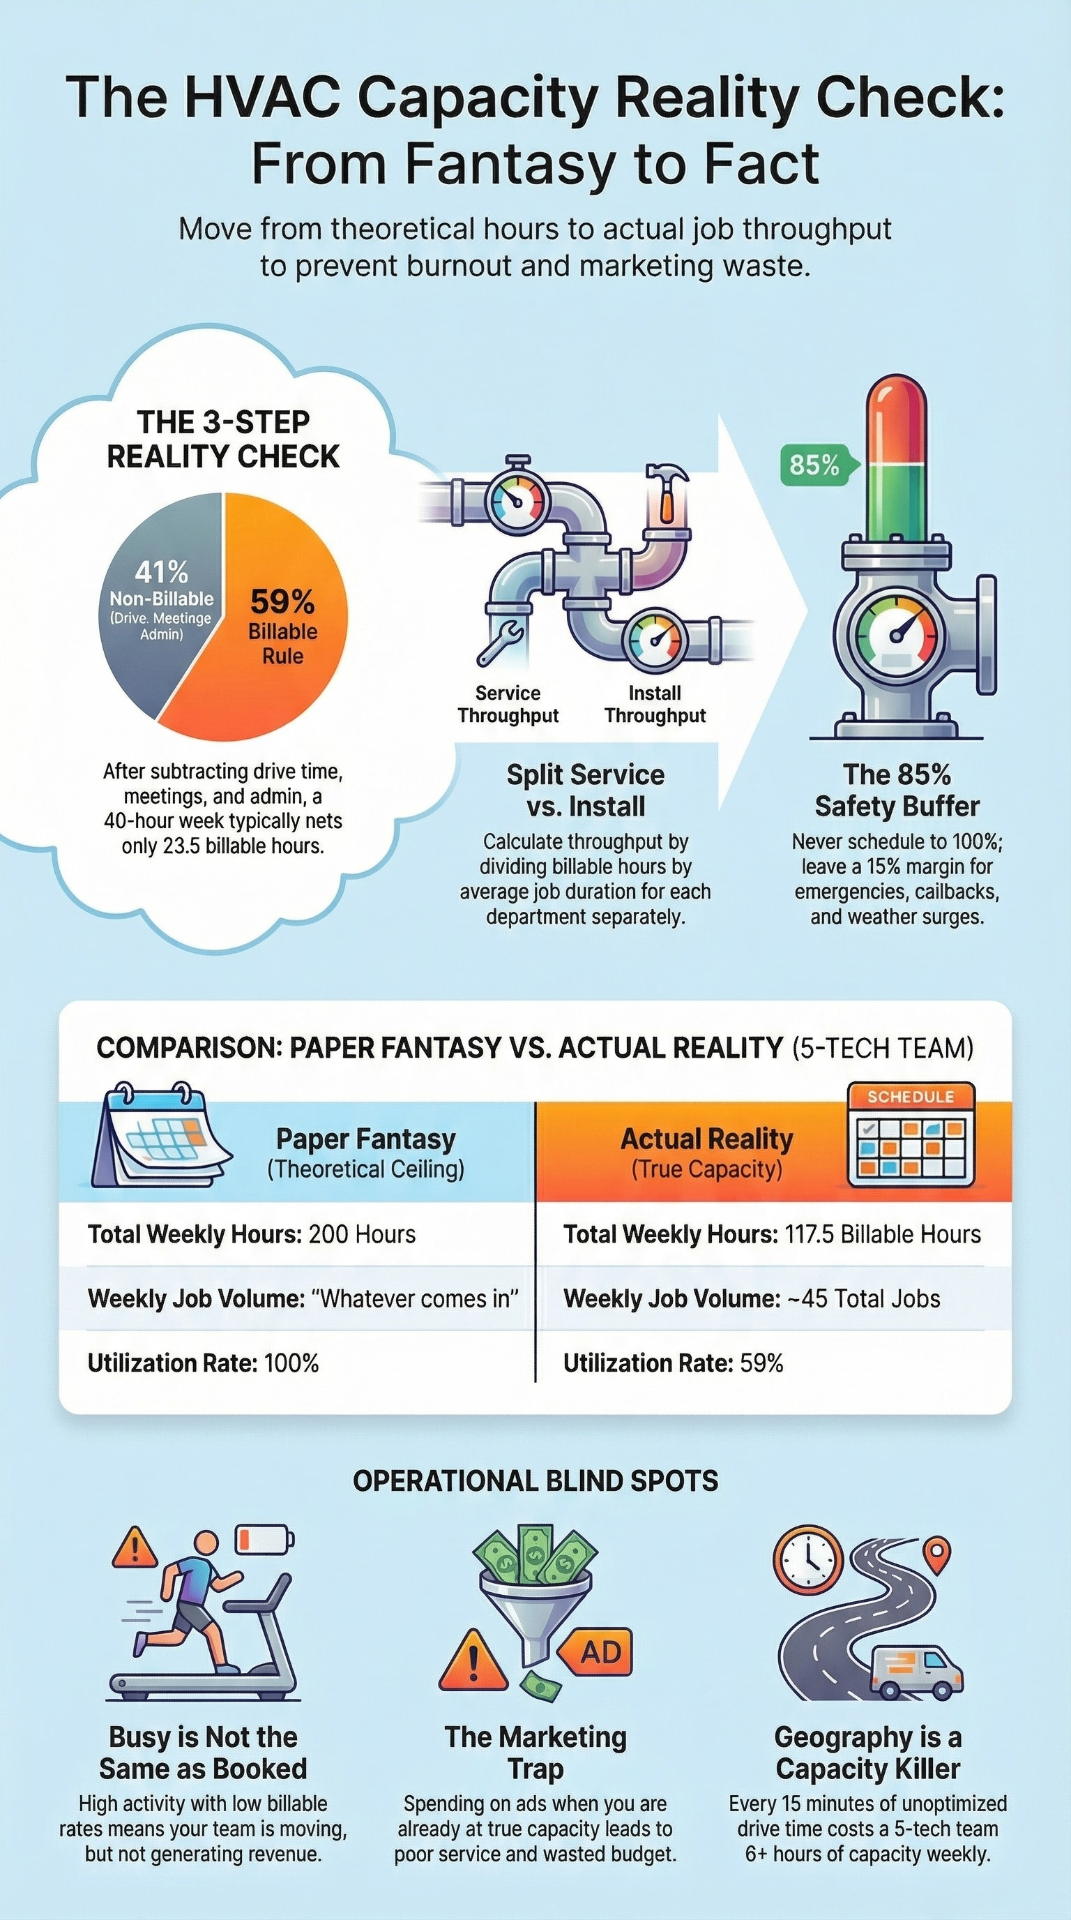
Ask most HVAC owners how many jobs their team can handle this week.
They'll give you a number.
It'll be wrong.
Not wrong by a little.
Wrong by 20–40%.
Sometimes more.
And that gap between what you think your team can do and what they can actually do is where money disappears. Where burnout starts. Where marketing investments go to die.
Most HVAC companies don't have a lead problem.
They have a capacity problem they've never measured.
This isn't a theory. This is math. And once you run these numbers for your own operation, you won't look at your schedule the same way again.
Here's the thing.
Capacity isn't headcount times eight hours. It never has been. But that's exactly how most owners calculate it, if they calculate it at all. Five techs, eight hours a day, five days a week. Two hundred hours. Done.
That number is a fantasy.
Let's kill it with real math.
Step 1: Start with Gross Available Hours
This one's straightforward. Count the humans. Count the hours. But be honest about what "available" actually means.
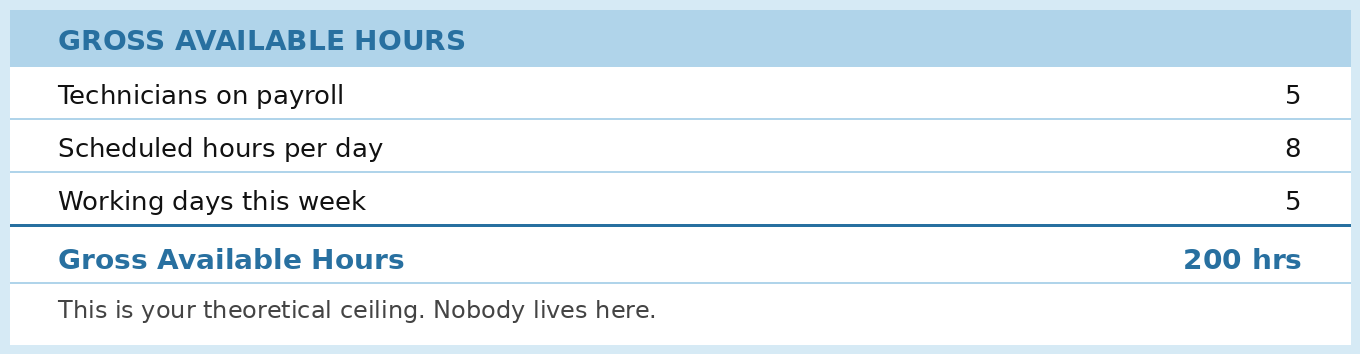
Two hundred hours. Looks great on paper.
Now let's subtract reality.
Step 2: Strip Out the Non-Billable Time
This is where most HVAC companies get it wrong.
Every hour on your payroll is not an hour generating revenue.
Not even close.
Your technicians do a lot of things that don't show up on an invoice.
And pretending those things don't exist doesn't make them go away.
It just makes your capacity number a lie.
Here's what actually eats your hours every single week:
| Non-Billable Activity | Hours / Tech / Week | Why It Exists |
|---|---|---|
| Drive time | 5–8 hrs | Windshield time between calls. Geography is real. |
| Morning meetings / dispatch | 2.5 hrs | 30 min/day of loading, briefings, paperwork. |
| Parts runs | 1–3 hrs | Supply house trips, warehouse pulls. |
| Callbacks & warranty | 1–2 hrs | Rework. It happens. Pretending it doesn't makes it worse. |
| Training / meetings | 1–2 hrs | Safety, manufacturer certifications, team syncs. |
| Admin & documentation | 2–3 hrs | Invoicing, CRM updates, job notes, photos. |
Add those up for a single technician. You're looking at 12.5 to 20.5 hours per week of non-billable time. Per tech.
That's not a rounding error. That's a quarter to half of their week.
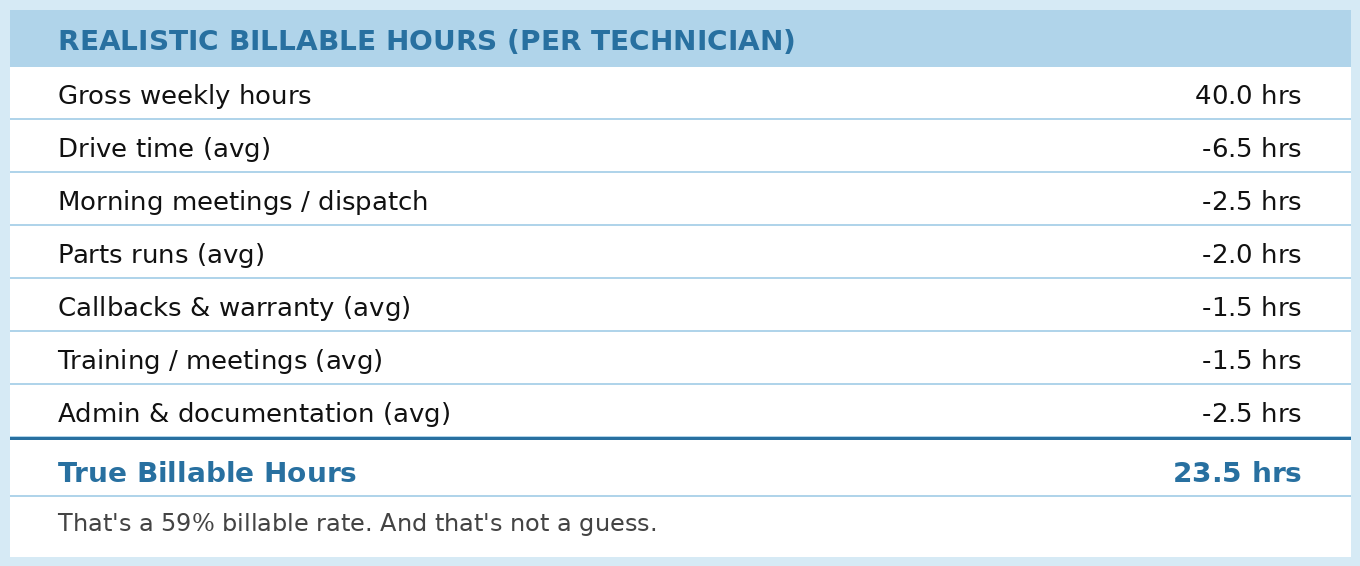
That's a 59% billable rate. And that's not a guess.
The Air Conditioning Contractors of America (ACCA) publishes operational benchmarks for residential HVAC contractors, and the utilization ranges above align closely with what they report.
When nearly half a technician's week disappears into non-billable activity, that's not an anomaly, it's the industry norm.
Let that land for a second.
Your five-tech team doesn't have 200 hours of capacity this week.
It has roughly 117.5 billable hours.
That's the real number. That's what you schedule against. That's what you sell into. Everything built on the 200 hour fantasy, your marketing budget, your hiring plan, your revenue projections are built on air.
You can't grow a business on capacity you don't actually have. You can only overload the team you've got.
Step 3: Split Service vs. Install Allocation
Here's where it gets interesting.
Not all billable hours are created equal. A service call and an install job have completely different revenue profiles, time demands, and scheduling.
Treating them the same is how you end up with a full board and thin margins.
HARDI (Heating, Air-conditioning & Refrigeration Distributors International) tracks distribution trends across the HVAC supply chain, and their data consistently reflects a reality most owners feel but never quantify: service and install work compete for the same labor hours, and the split between them determines your true throughput.
Most residential HVAC operations run some version of this split:
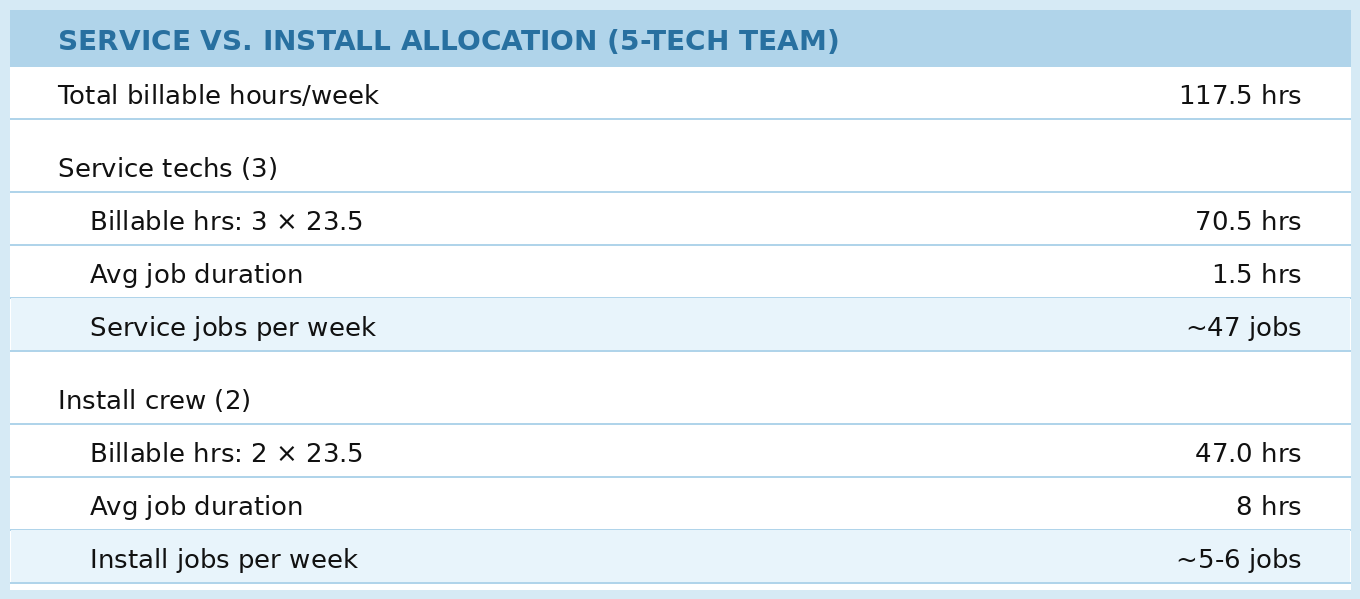
This split isn't just operational, it's strategic. Service vs install capacity completely changes your marketing approach, from budget allocation to channel selection.
Now you have something actionable. Forty-seven service calls and five to six installs. That's your real weekly throughput at current staffing.
And this is where most HVAC companies get stuck.
They generate demand without knowing these numbers. They run ads. They push for more calls. They invest in marketing that's optimized for volume without understanding whether their operation can absorb it.
They're generating demand...
without building the system to handle it.
Forty-seven service calls is the ceiling for this team.
Not forty-eight. Not "we'll figure it out." Forty-seven.
And that number already assumes average conditions. No sick days, no truck breakdowns, no freak weather event that sends callbacks through the roof.
Step 4: Build In Your Buffer (Because Real Life Happens)
Smart operators don't schedule to 100% of capacity.
They schedule to 80–85%.
That's not leaving money on the table.
That's leaving room for reality.
Emergency calls.
Callbacks that run long.
The install that hits a surprise in the attic and takes an extra three hours.
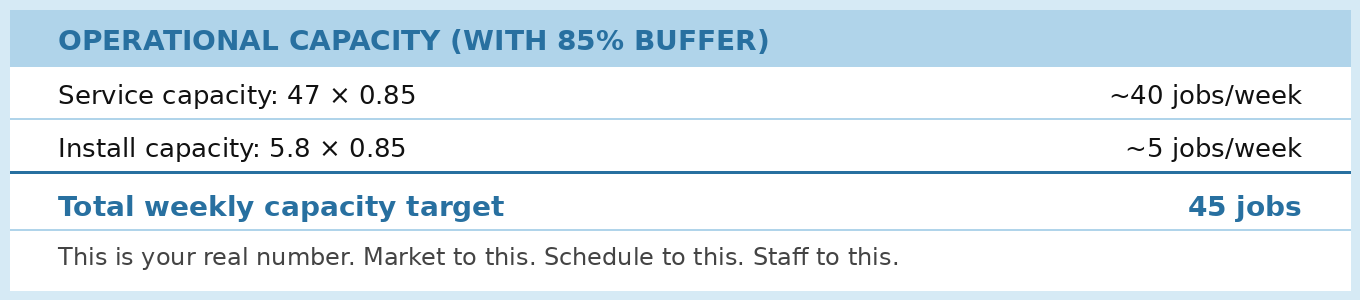
This is your real number. Market to this. Schedule to this. Staff to this.
Forty-five jobs. That's it. For a five-person team with a three-service, two-install split.
Not two hundred hours. Not "whatever comes in." Forty-five jobs.
Now this is where it gets interesting.
The Owner Blind Spots
You've got the math now. But math only helps if you're willing to see what it reveals. And in HVAC operations, there are specific blind spots that keep showing up business after business, year after year.
Blind Spot #1: Confusing "busy" with "at capacity."
Your board is full. Your phones are ringing. Your techs are running around all day. But your billable rate is 52%. Half of the motion is non-revenue activity that feels productive but isn't. Busy and booked are not the same thing.
Blind Spot #2: Ignoring drive time in scheduling.
The average HVAC technician spends over 20% of their work week in a vehicle.
In sprawling service areas, it's closer to 30%. If your dispatcher isn't routing geographically, you're burning billable hours on windshield time.
Every 15 minutes of unnecessary drive time across five techs is over 6 hours of lost capacity per week.
The U.S. Bureau of Labor Statistics reports that HVAC technician demand is projected to grow 8% through 2034 reinforcing that technician capacity is a structural constraint, not a short-term issue.
Blind Spot #3: Marketing without a capacity number.
This is the one that costs the most money. You invest $8,000/month in marketing. Leads increase.
Calls increase.
But you've already got 40 service jobs scheduled. Your team's true capacity is 40.
So the extra leads either get long hold times, delayed scheduling, or rushed work. The marketing "worked" but the business can't absorb the result.
We wrote about this disconnect in detail in Why Most HVAC Marketing Fails Before It Starts and the root cause is almost always the same: spending on demand before understanding capacity.
Blind Spot #4: Not tracking the service-to-install ratio.
Service calls and installs compete for the same labor pool.
When install season spikes, service response times suffer unless you planned for it.
If you don't reallocate capacity ahead of that shift, you're reactive. Reactive means lost revenue or lost customers. Usually both.
According to AHRI monthly shipment data, residential HVAC equipment shipments swing dramatically by season with summer months routinely peaking well above baseline. That seasonal surge lands directly on your install crew's schedule.
The goal isn't more leads.
The goal is controlled demand.
Enough to keep teams fully scheduled...
without overwhelming operations.
What This Looks Like as a Weekly Dashboard
Once you have the math, you need to track it.
Not in your head.
Not on a whiteboard that hasn't been updated since Tuesday.
In a system you actually look at.
Here's the minimum viable weekly capacity dashboard:
| Metric | Target | Actual |
|---|---|---|
| Service jobs completed | 40 | ___ |
| Install jobs completed | 5 | ___ |
| Callbacks / warranty returns | < 3 | ___ |
| Avg drive time per tech | < 6.5 hrs | ___ |
| Jobs turned away / rescheduled | 0 | ___ |
Now that you know your true capacity, you can reverse engineer lead volume. Here's how to calculate exactly how many leads your HVAC company actually needs based on your numbers, not industry averages.
Let's be honest.
Most HVAC owners won't fill this out. They'll read this article, nod, and go back to eyeballing the schedule.
The ones who actually run these numbers? They're the ones who stop guessing when to hire.
Who stop overspending on marketing they can't absorb. Who stop wondering why their team seems burned out even though revenue is "up."
If your marketing only works when you turn it on...
you don't have a system.
You have a lever. And levers break.
The Real Takeaway
Capacity is not a feeling. It's not what your gut says the team can handle. It's a number and you can calculate it in about fifteen minutes with the framework above.
Use this capacity planning checklist to make sure operations, pricing, and team structure align before you spend on marketing.
Here's what changes when you do:
Your marketing gets smarter. You stop buying leads you can't serve and start aligning spend to actual throughput.
If you want to see what that alignment looks like in practice, read How HVAC Marketing Actually Works. It walks through the full process, from generating demand to filling your board without the guesswork.
ENERGY STAR's HVAC contractor programs emphasize that properly structured operations where installation quality and capacity are tracked consistently outperform those running on volume alone.
The same principle applies to your marketing: when demand aligns with what the team can actually deliver, conversion rates climb and callbacks drop.
Your hiring gets proactive. When you know you're at 92% of true capacity, not "we're really busy", you hire before the wheels come off.
Not after.
Your schedule gets predictable. This is the part that matters most.
Predictable schedules mean predictable revenue.
Predictable revenue means you can actually plan equipment purchases, raises, expansion. The stuff that separates a job from a business.
Think about it.
Every decision in your business flows downstream from capacity. Marketing, hiring, pricing, customer experience, all of it.
And if that foundational number is wrong?
Everything built on top of it is wrong too.
This is why we don't start with ads. We don't start with a new website. We don't start with "more leads."
We start with the math.
Because you can't build a system on a guess.